Observing the Milky Way with a Modified Satellite Dish
With the simplest of means and a budget of under €200, it is now possible to practise radio astronomy yourself and make the Milky Way visible — even in the middle of a large city like Berlin. As part of our project we have shown that a modified satellite dish, a low-noise preamplifier, and an inexpensive SDR receiver are sufficient to obtain surprisingly detailed data about our galaxy. The required technology is now within reach of anyone, and the analysis can be carried out with freely available software even without programming knowledge.
Our starting point was a standard 1-metre satellite dish of the kind used for television reception. We combined it with a dedicated receive feed for 1420 MHz, a Sawbird H1 preamplifier, and a Nooelec NESDR SMArTee SDR receiver.
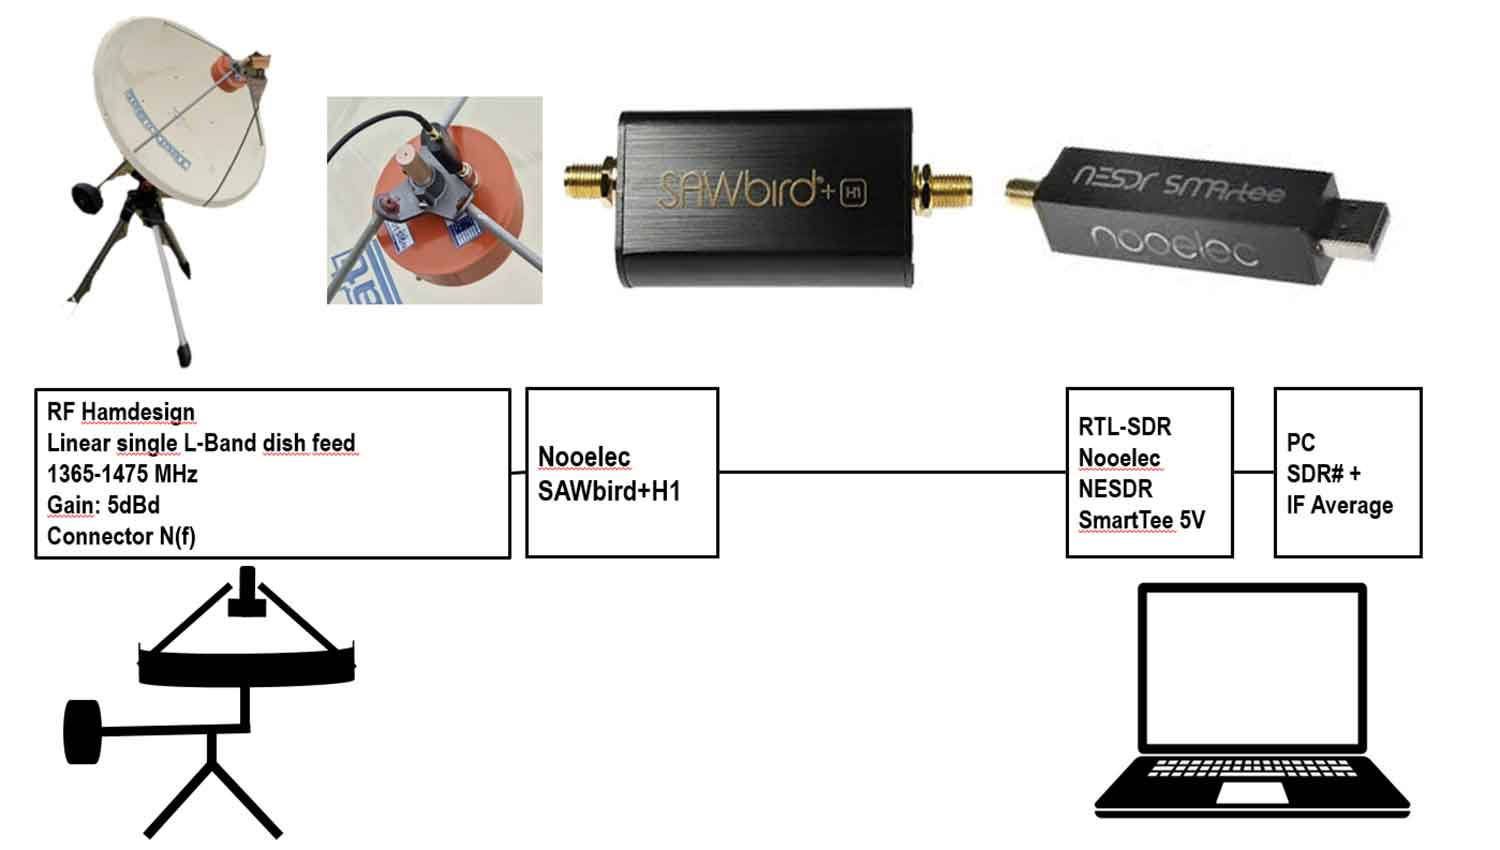
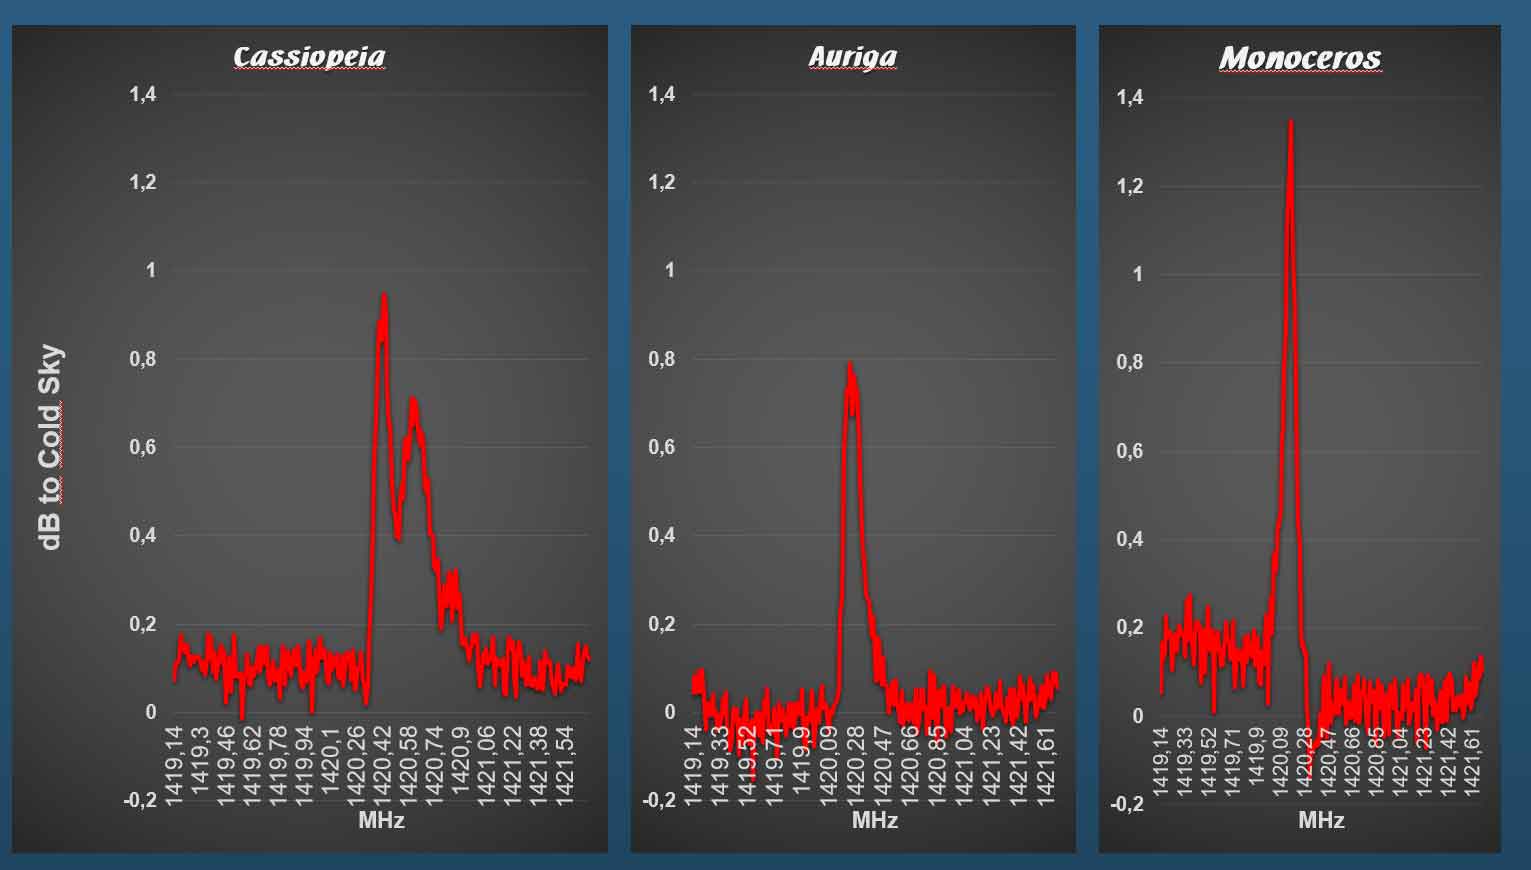
Even with this configuration we were able to receive clear signals from the 21-centimetre hydrogen line — the characteristic radio wavelength emitted by neutral hydrogen, the most abundant element in the universe. Despite the electromagnetic interference sources typical of a large city, the galactic hydrogen spectra were clearly visible after just a few seconds of integration time. The signal rise in the narrow hydrogen line band was up to 1.3 dB above the noise floor.
To increase the resolution of our measurements further, we deployed a 1.8-metre C-band satellite dish of the type used for television reception in Africa and Asia. These are available at low cost from Chinese suppliers and, despite their simpler build quality, are perfectly adequate for radio astronomy experiments. The rest of the receiving equipment remained unchanged. Instead of a complex motorised mount, we used Earth’s rotation to perform meridian transits: the antenna was pointed south and celestial objects drifted automatically through its field of view.
For data analysis we used the free open-source software ezRA (“easy Radio Astronomy”), which computes signal curves with just a few clicks and generates radio images of the sky from them. This allowed us to map the Milky Way as a luminous band — even during the day and under cloud cover — something that is impossible in optical astronomy.
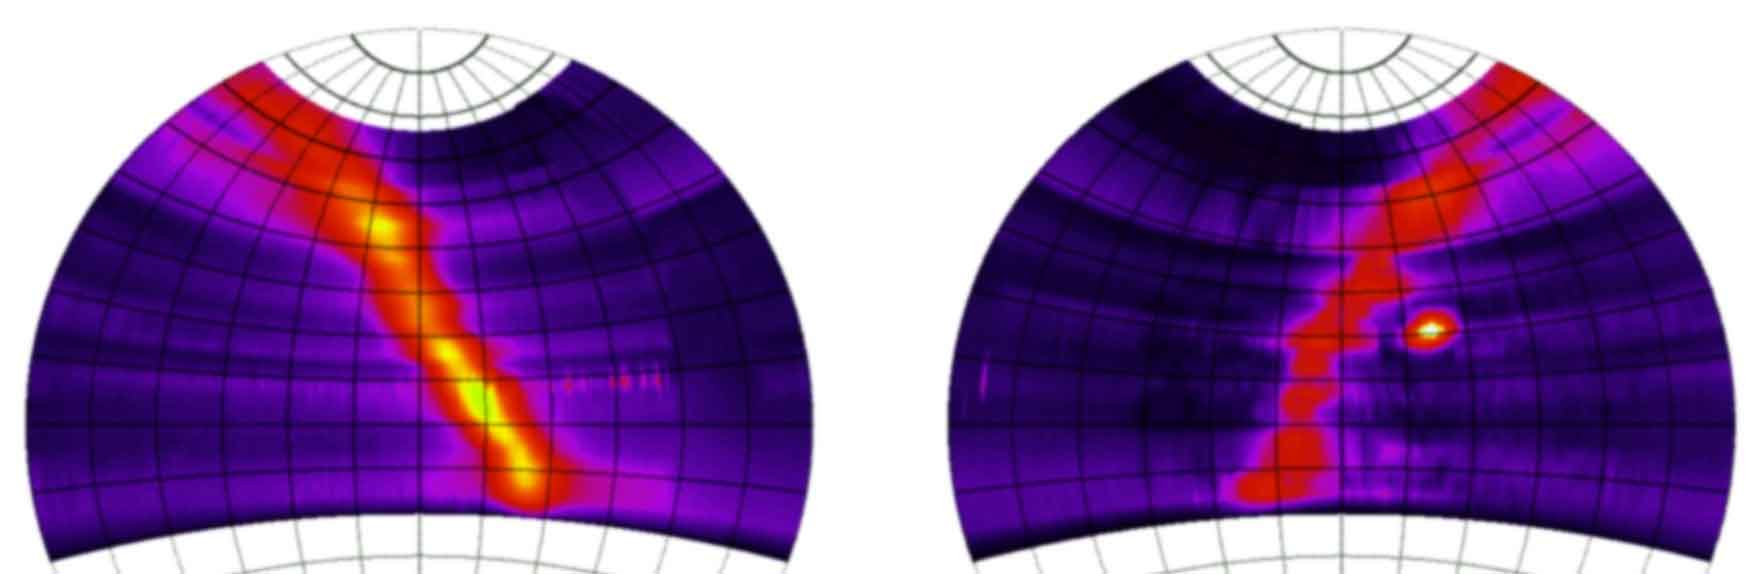
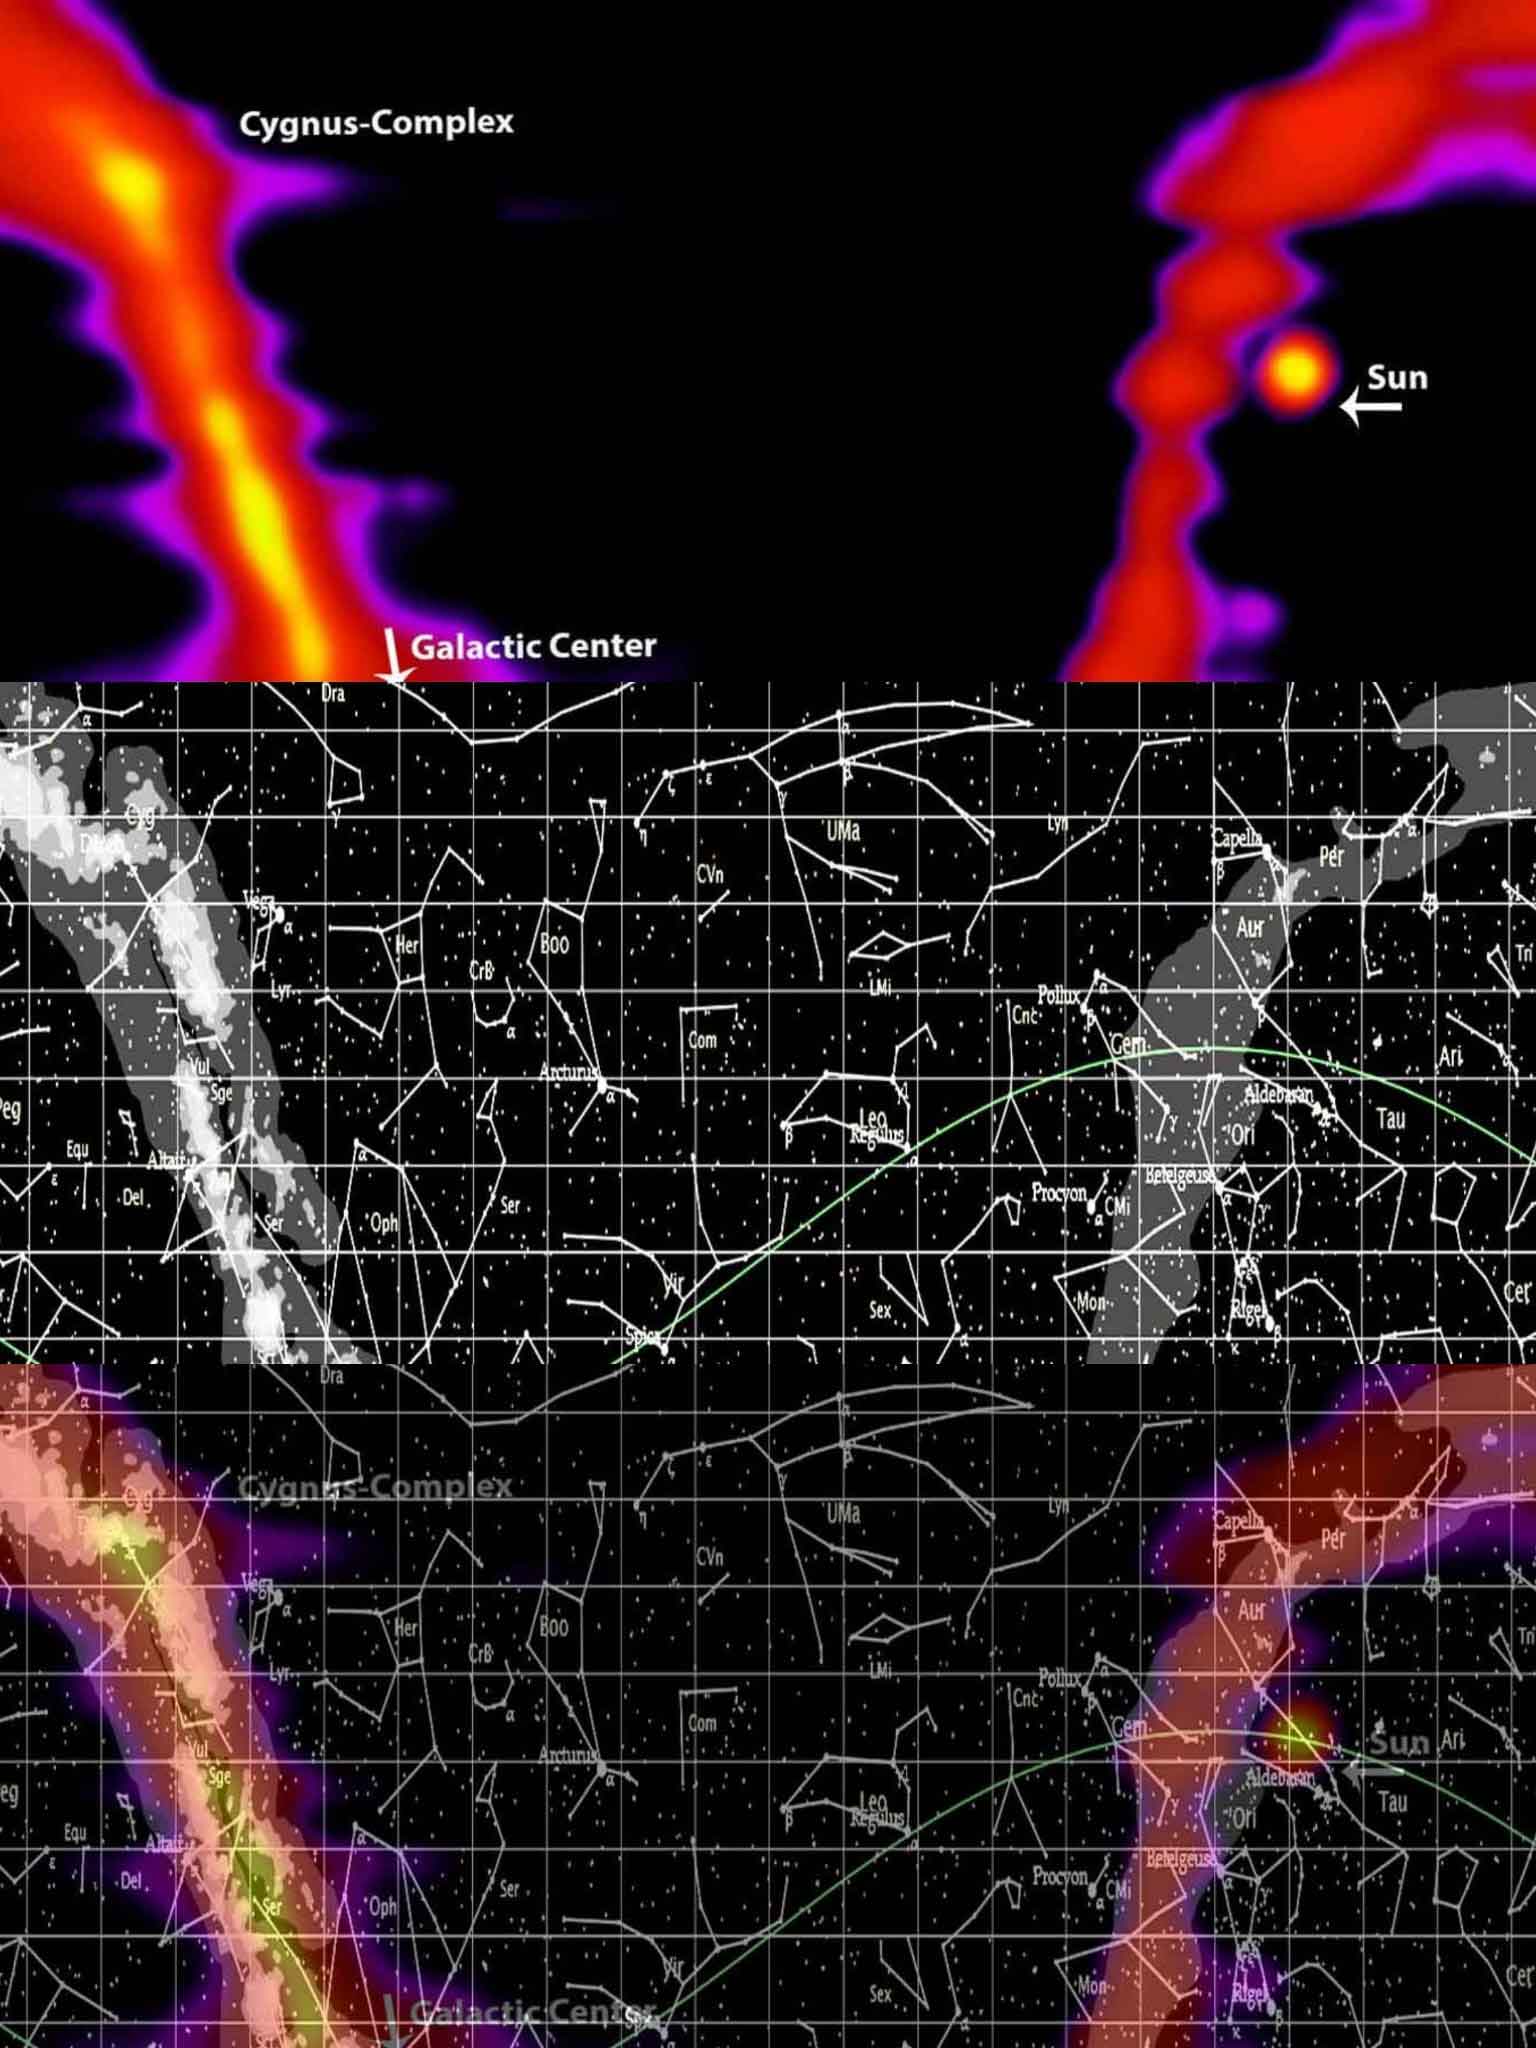
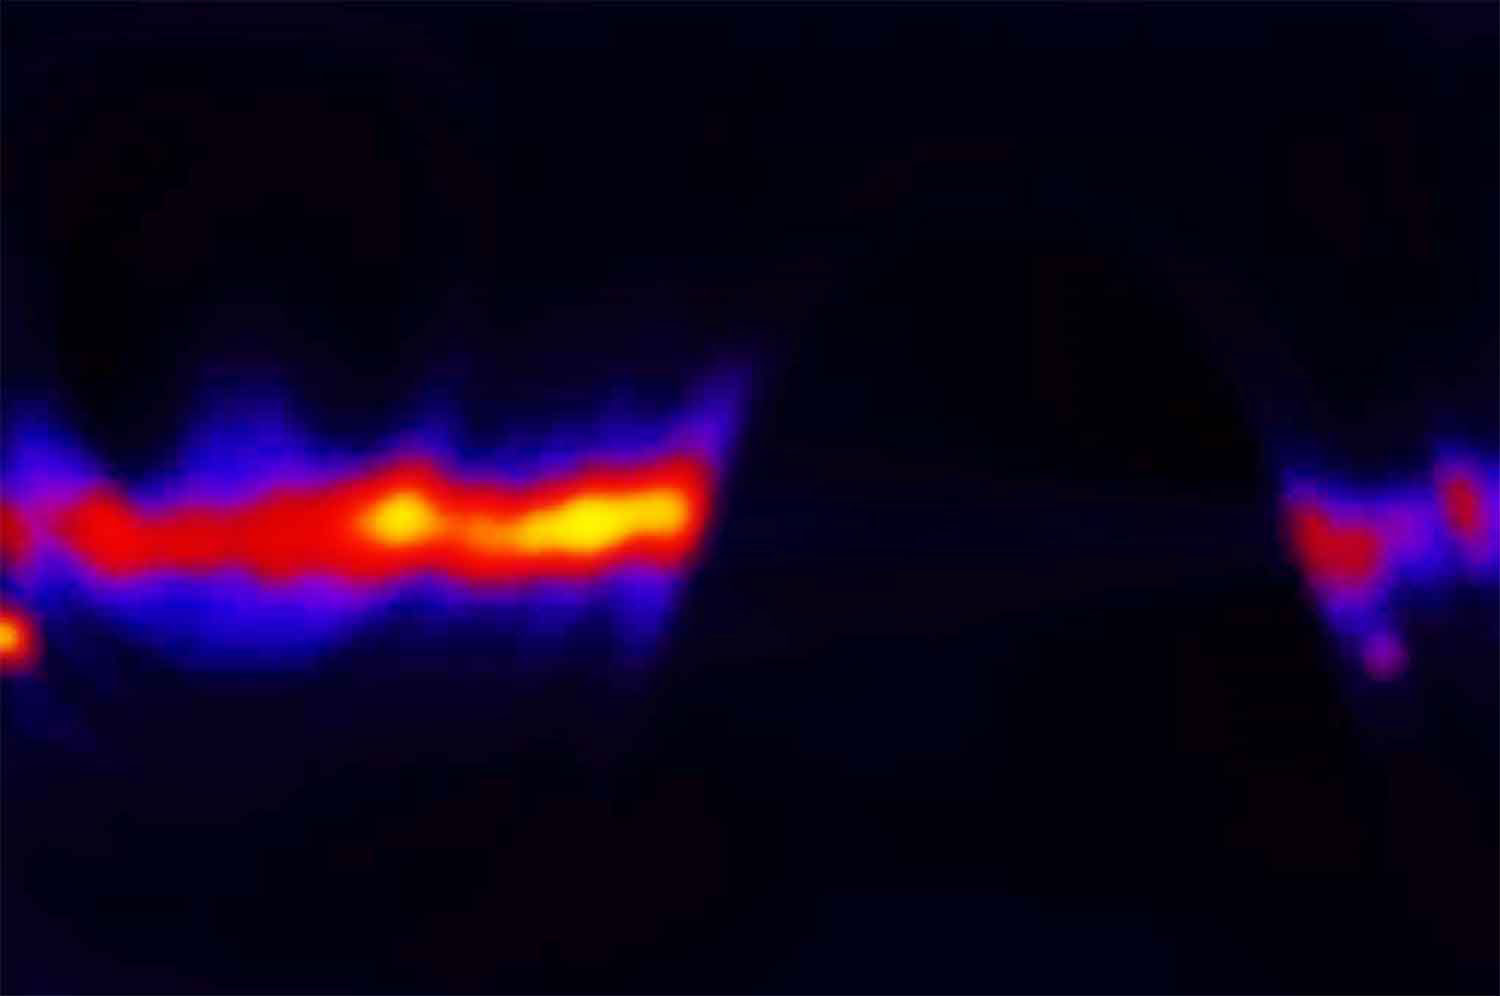
The images produced are based on several dozen sky transits during which we varied the antenna elevation by a few degrees each time. The software combines the data, arranges it along sky coordinates, and produces impressive radio maps. Particularly striking was the brightening in the region of the Cygnus X complex — a vast star-forming region hidden from optical view by dust clouds but clearly prominent in the radio domain.
In addition to the radio images, we were also interested in analysing the motion of hydrogen clouds within the galaxy. Because the spiral arms of the Milky Way move at different velocities relative to our solar system, this manifests as a Doppler shift in the spectra.
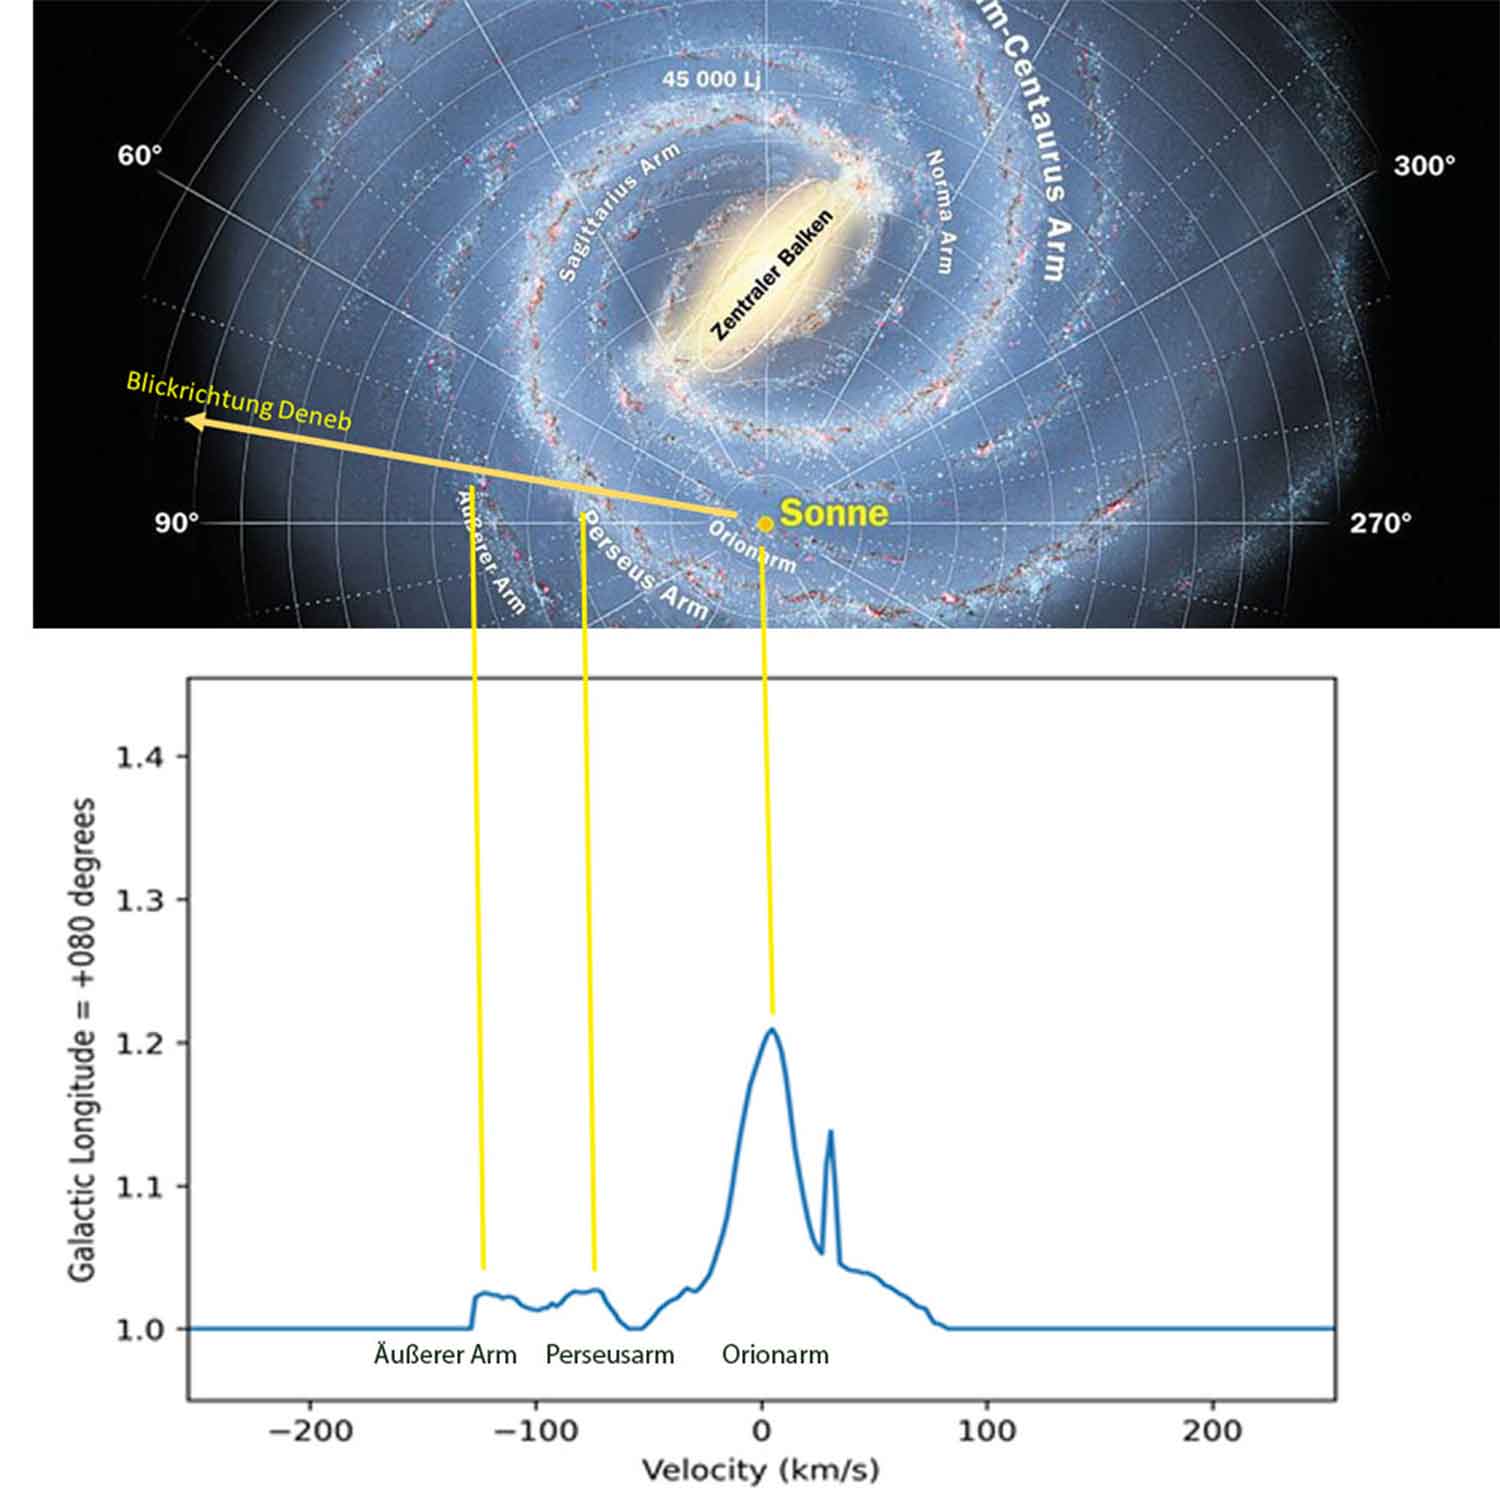
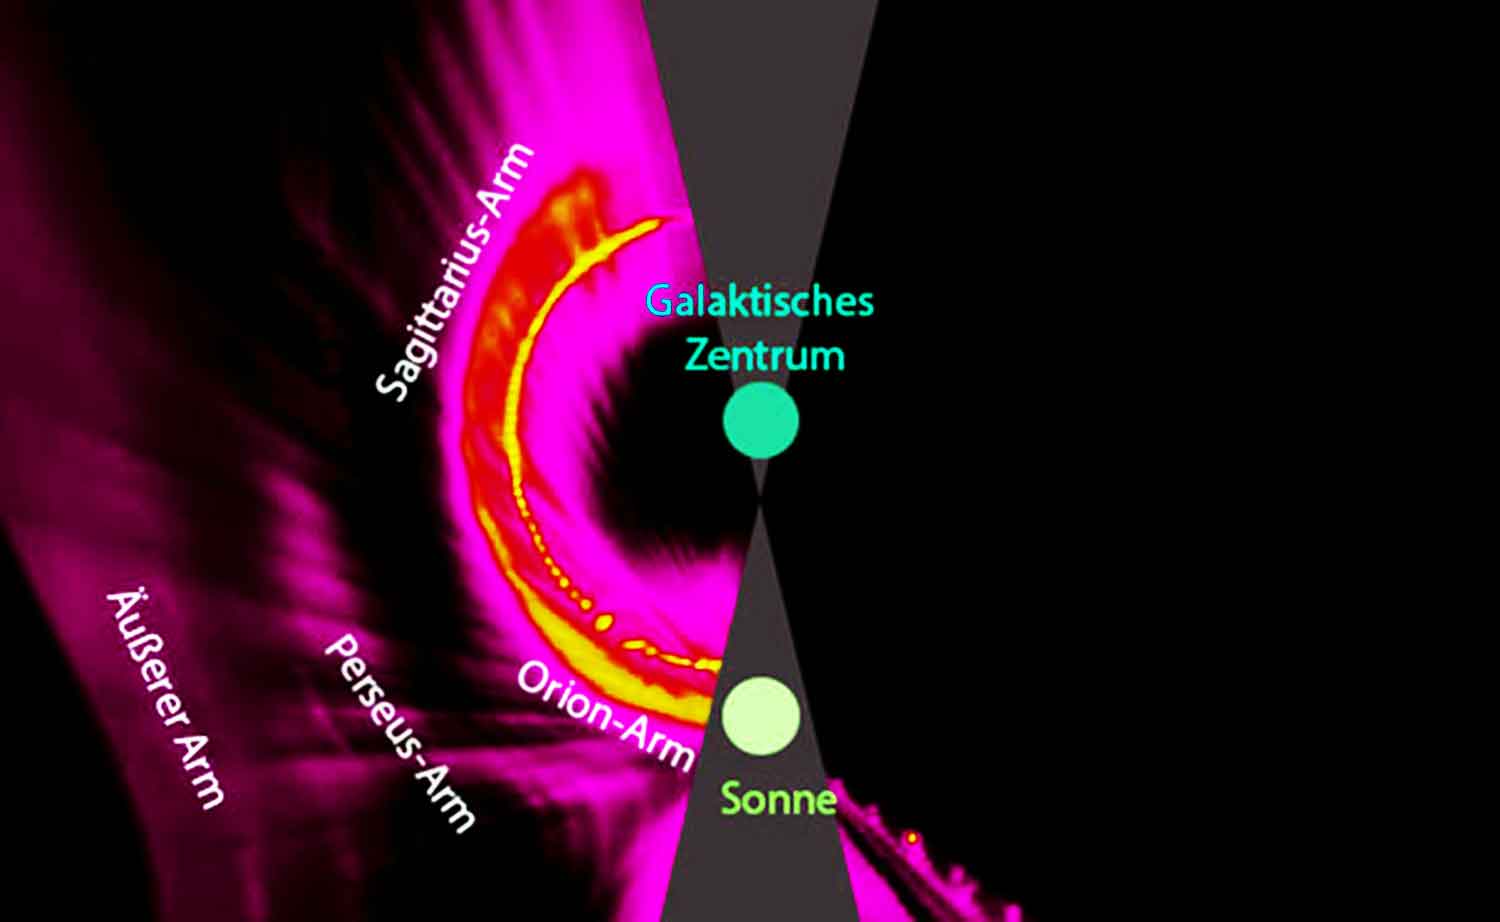
Using ezRA we were able to evaluate these shifts and calculate the radial velocities relative to the so-called Local Standard of Rest. This gave us not just a spectrum but also a spatial distribution of the hydrogen clouds — and with it a picture of the spiral structure of our Milky Way.
The results of our work demonstrate that radio astronomy is no longer the exclusive domain of professional research. With the simplest of means, a degree of technical understanding, and freely available software, it is possible to gain insights into our galaxy that are not only scientifically interesting but also aesthetically impressive. Our project exemplifies the potential of home-built instrumentation and is an open invitation to follow suit — whether as a hobby, in schools, or at universities.