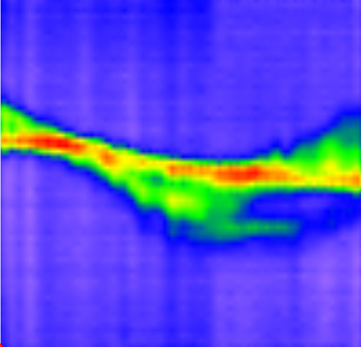
Spectral map of the Milky Way at 1420.4 MHz between the constellations Canis Major and Sagittarius.
After observing the galactic anticenter with the 1-metre radio telescope at night, we also observed the section of the Milky Way towards the galactic centre that is visible from the northern hemisphere during winter daytime hours. We combined the observation data and produced a spectral map of the Milky Way as seen from Berlin.
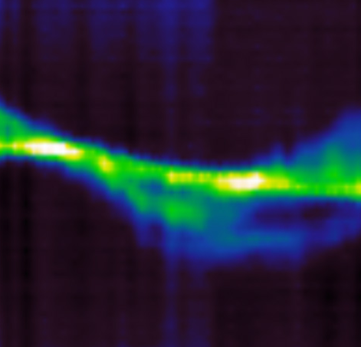
On the left side of the image the brightening of the galactic anticenter is visible; on the right side the broadening caused by the rapid rotation in the central bulge of the Milky Way.
The spectral map was recorded using our 1-metre satellite dish, a full-wavelength loop feed specifically designed for 1420 MHz, a Sawbird H1 LNA, a Nooelec SDR, and SDR# with the IF Ave plugin. The individual spectra were merged, calibrated, and scaled to dB values using H-Line 3D by Alex Pettit. Visualisation was then carried out with the program Surfer.
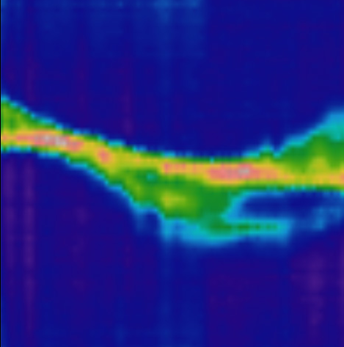
There are many programs available for visualising elevation data for geographic purposes, of which Surfer is one example. Others include QGIS — all of these are equally suitable for visualisation in radio astronomy. These programs offer various methods for interpolating data into a contour map; we used the minimum curvature method, for instance.
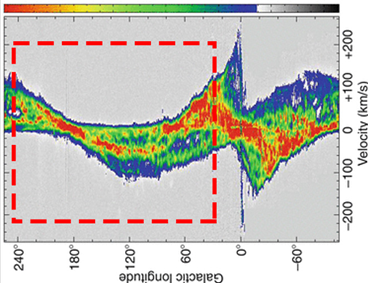
For comparison, a professional spectral map recorded by John M. Dickey using the Green Bank Radio Telescope in the USA in combination with data from the Parkes Radio Telescope in Australia. Source: Dickey, J.M. (2013). Galactic Neutral Hydrogen. In: Oswalt, T.D., Gilmore, G. (eds) Planets, Stars and Stellar Systems. Springer, Dordrecht. https://doi.org/10.1007/978-94-007-5612-0_11 The region we observed is indicated by the box.
Back to top